
The figure below shows the policy rate gap calculated up through 2007:Q4 using two different approaches. The first approach, indicated by the red line, takes difference between the year-on-year growth rate of nominal GDP and the average federal funds. The second approach, marked by the blue line, uses the annualized quater-on-quarter growth rate of nominal GDP. Both approaches show that policy rate gap turns sharply negative during NBER recessions. The figure also shows a neutral-to-slightly easing monetary policy stance by end of last year. This figure suggests that if the U.S. is in a recession this quarter and if the past is any guide to proper monetary policy, then it is appropriate for further policy rate cuts. (Click here for larger picture)

Plugging this metric along with the yield curve spread (10year-3month) into a probit model, where the dependent variable is a NBER-recession dummy variable, creates a simple but powerful tool for predicting recessions. The model specifically was designed to predict one quarter ahead. The figure below shows the results from this model up through 2008:Q1. The red and blue lines again come from what policy rate gap was used. (click here for larger picture)

This figure shows the probability of a recession this quarter is at most about 40%, down from a high of abour 60% a few quarters back. These numbers are surprising given the considerably higher probability numbers on the recession contract at Intrade.com (65% today). What I conclude from this brief analysis is (1) either my model is misspecified (a very good chance!) or (2) Big Ben should not be as worried as he is about the economy. Time to recheck the model!
Update
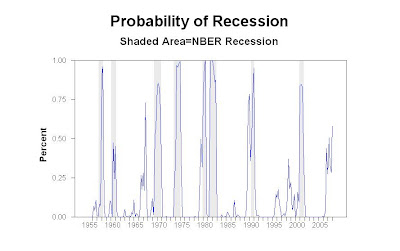
I reestimated the above model, but this time included the spread between Moody's Aaa and Baa bond yield. Now, the model's recession probability for 2008:Q1 is about 60%, much closer to the 65% Intrade value. Including all three explanatory variables--the poilcy rate gap, the yield curve spread, and the corporate spread--improves the fit of the model (pseudo R2 of 63%) and produces a probability more in line with conventional wisdom. (Click here for larger picture)
No comments:
Post a Comment