
Tyler Cowen responds to some of the Great Stagnation critics by pointing to trends in total factor productivity (TFP):
The critical responses to The Great Stagnation prefer to attack median income measures and in general they are reluctant to talk about total factor productivity. Yet we are pointed very much toward the same conclusion.
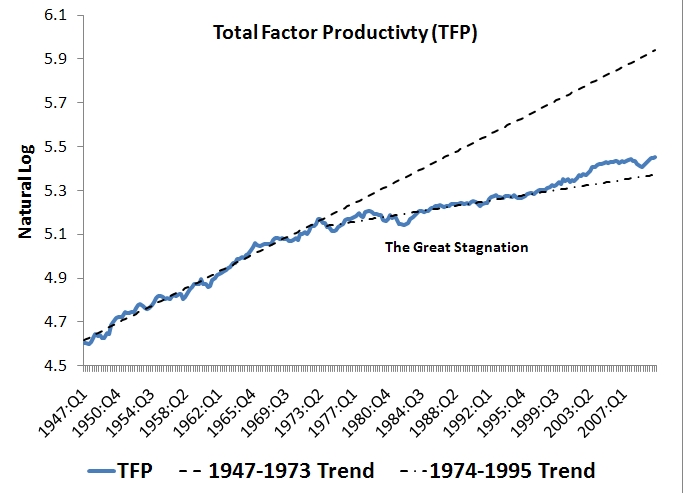
The point is that the Great Stagnation theory matches nicely with the standard story of TFP growth: there was a "golden age" of TFP growth during the1948-1973 period, but thereafter it stalled until about 1995. That is an interesting rebuttal from Cowen, but haven't we made some impressive TFP gains since 1995 given the advances in technology? To see just how marked this TFP decline was after 1973 and whether the recent TFP gains make up for any of the loss, I went to the data. Below is a figure constructed using the quarterly TFP series of John Fernald at the San Francisco Fed. (Click on figure to enlarge.)

Okay, I am impressed and far less skeptical of the Great Stagnation theory. In my previous post I argued that Cowen failed to appreciate how dramatically our lives have changed since the advent of the internet and faster computing. Now I am thinking these gains are but a faint shadow of what they could have been had TFP continued to grow at its 1947-1973 trend. The "good old days" really were better in terms of TFP growth.
Still, I wonder how much of the true, underlying TFP gains are being measured given the large share of our economy that is in the service sector, where output and productivity are hard to measure. Also, I am optimistic that we are on the cusp of a Great Acceleration for the global economy. Technological gains continue and the rest of the world's catch up growth is bound to create positive spillover effects for the advanced economies. As I mentioned before, imagine what will happen to R&D funding on cancer and AIDS once several billion Asians are rich enough to start demanding it. (In fact, they may be a big part of the solution to U.S. health care problems.) This HSBC report also makes the case for an impending Great Acceleration. I am optimistic about the future.
David
ReplyDeleteLeonard Nakamura of the Philly Fed has done work in that area. Here´s an article from 1997.
http://www.philadelphiafed.org/research-and-data/publications/business-review/1997/march-april/brma97ln.pdf
His Figure 1 more or less replicates the figure in the post. I remember that in 1999 I saw a revision of Figure 1. It changes significantly. TFP (MFP) flattens between 1965-81 and then takes off again. This was much more consistent with what had happened to the stock market!
Off topic, I did a post commenting on Ryan Avent´s take of the late 1990´s:
http://thefaintofheart.wordpress.com/2011/02/11/tales-from-the-crypt/
Mancur Olsen had a nice theoretical explanation. Over a period of stability, special interest groups build up their power and gradually strangle economic growth. We saw it in UK (unions), Japan (nontradeable goods sector), and we are seeing it in the US (financial sector). Olsen's Rise and Decline of Nations remains the most important book for people to read to understand what is going on, not the johnny-come-lately Cowen.
ReplyDeleteOne other point, stimulated by Roubini: with the US in decline, there is no longer a credible global hegemon enforcing the public goods of free trade and capital flows. That might crimp the Great Acceleration outside of the US. Just a thought.
ReplyDeleteECB:
ReplyDeleteGreat points. I have been meaning to read Olsen's book for some time. It is sobering to think about a void arising in the production of global public goods. What Roubini piece are you referencing?
Probably the ones on G-zero
ReplyDeletehttp://www.roubini.com/roubini-monitor
The BLS maintains a database of annual TFP for the US back to 1948. A good source of information on TFP growth prior to that is a few of papers by Alexander J. Field: “US economic growth in the gilded age”, “The Most Technologically Progressive Decade of the Century” and “The origins of US total factor productivity growth in the golden age”.
ReplyDeleteAverage annual TFP growth is as follows:
1835-1855-0%
1855-1869/1878-(-0.5%)
1869/1878-1892-2.0%
1892-1919-1.1%
1919-1929-2.0%
1929-1941-2.8%
1941-1948-0.5%
1948-1973-1.9%
1973-1995-0.5%
1995-2005-1.5%
The first thing that should grab your attention is that TFP growth was at its most rapid during the Great Depression. The second thing you should observe is that TFP growth was at 1.9% or higher from the 1870s through 1973 with the exception of 1892-1919 and 1941-1948. TFP growth has picked up since 1995 (but has slowed since 2005). So this pretty much supports Tyler Cowen’s conjecture.
Now, why was TFP growth faster during the periods mentioned?
Well, Field analyzes the growth by sector and sector size and comes to some interesting conclusions. TFP growth was fast from the 1870s through 1892 because of railroads (which peaked in track mileage in 1916) and to a much lesser extent because of the telegraph. Almost all growth in TFP in the 1920s can be accounted for by manufacturing and that probably fed that decade’s stock market boom. Why did manufacturing TFP explode in the 1920s? According to Field it was due to the widespread electrification of factories (which had started in the 1880s). In the 1930s manufacturing TFP, although still relatively fast, slowed down. (He also points out that private R&D quintipled from 1929-1941.) But transportation TFP soared from 1929-1941 mainly due to the five fold increase in the share of tons-miles hauled by interstate trucking and its interaction with railroad transportation. (The US built its first interstate highway system in the 1930s.) And he argues that transportation TFP was largely responsible for the growth seen from 1948-1973, as manufacturing TFP actually went negative for part of that period. (And recall the Interstate Highway System, built on top of or paralleling the US Route system of the 1930s was largely completed from 1956-1973.) TFP growth was negative from 1855 to the 1870s primarily because of the Civil War.
Recent work by Bart van Ark shows that TFP in the distribution sector was the main source of the surge in growth from 1995-2005, and he argues that was due to the widespread adoption of ICT technology by that sector. (Think big box Walmarts.)
What's interesting is that Federal government money played a major role in all of those developments with the exception of factory electrification (urban areas were largely electrified with private money). This of course comes with the qualifier that much of public fixed investment is probably nonproductive. But evidently some of it mattered a great deal.
Almost every economic data series I've looked at (typically log scale) shows a break point to lower growth between 1973 and shortly after 1980.
ReplyDeleteTo Mark Sadowski's point, here's a very specific example.
Others include:
Yr over Yr GDP growth
Yr over Yr total payroll growth
Real disposable income per capita
Median family income growth
Relative motion of sticky and flexible inflation measures, per Krugman (lockstep to 83, decoupled after)
Nonfarm productivity growth generally in decline 1966-82, then generally improving through 2002.
(BLS series PRS85006092.)
Federal non defense spending.
State and local spending.
Treasury yields.
From about 1960 through 1980, inflation correlated with federal deficits. Since, it does not. Earlier, it seems not to have, either.
Plus this on money demand function, which I haven't read yet
I think the low-hanging technology fruit idea is bogus, but I've been calling the period since 1980 the Great stagnation for about a year - long before Cowan's book came out.
Cheers!
JzB
What happened at the end of 1973, concurrent with the change in slope of the TFP graph? One thing that occurred was the US uncoupling the dollar from the gold standard.
ReplyDeleteThis event incented production to migrate to globally cost-competitive geographies, rather than to stay where it is artificially competitive due to currency policy. It could be that certain productivity gains were effectively outsourced beginning in the mid 1970's.
Anecdotal examples may include industries that represented a large proportion of the GDP: steelmaking and automaking. If productivity gains were realized outside the US in these industries, even dramatic productivity increases in other industries might not offset the dampening effect on TFP in the US.
This may be a stupid question, but why are you using a logarithmic scale? The curve looks like a logarithmic curve. What happens if you plot it on a linear scale, or fit it to a logarithmic curve?
ReplyDeleteIs the underlying point that TFP is not supposed to just grow, but to grow exponentially? I don't follow why its failure to do so would represent economic stagnation?
It may be no coincidence that the great stagnation begins with our getting off the gold standard (might monetarist policies actually have the opposite effect Friedman imagined?), with a new set of economic policies involving ever-greater interventions, with ever-greater government expenditures and deficit spending, etc. All of this growth in government and the gradual destruction of our money is what has been stagnating this country.
ReplyDeleteI believe total factor productivity differences between the pre-1973 period and now are quite understandable. Before 1973, production was extremely inefficient, and even smaller technological improvements caused a remarkable increase in the effectiveness of labor and capital. Production costs, transportation and transmission costs, and most importantly time costs ended up blowing a huge hit to productivity. After 1973, technological advancements made it much easier to make a dollar of output compared to the era before then. The age of technology and automation allowed us to do a lot more a lot quicker than before.
ReplyDeleteToday, it is much harder to cause a marked increase in productivity since with the current technologies in use, we are pretty close to being as efficient as we can get. While there is still room for improvement, most of the low hanging fruits which resulted in bigger productivity improvements have already been plucked. In other words, we have hit a wall of TFP improvements and its much harder to create a big jump in total factor productivity. The limiting factor in further increasing productivity today is not technology, but human capability. A computer may be able to process millions of bits of information per second, but we can only utilize as much as our brains and bodies can process. To give an example, writing a letter by hand (including all the time lost due to rewrites caused by errors) would have taken a long time. The invention of typewriters reduced this time much. Computers made this process even more efficient to the point where the limiting factor now is human typing speed and not the technology. From here on, any further increase is productivity in letter writing is unlikely. Similar examples can be found with most technologies in use today. What we need now is huge innovations of the sort that computers were, that drastically alter the way we do work.
Another different area that I believe could help explain the lower TFP since the 1970s is effective labor. It would be interesting to see how much effective labor in the US has changed since the 1970s and the impact that has had on total factor productivity. With the crumbling US public school system, poor health, rising healthcare costs etc, I'm pretty certain the effective labor has been going down which might also explain the low TFP. Despite technological improvements, each unit of labor may be producing less now because of these social and psychological changes going on within the population which reduces motivation and incentive to do more and better.
> As I mentioned before, imagine what will happen to R&D funding on cancer and AIDS once several billion Asians are rich enough to start demanding it. (In fact, they may be a big part of the solution to U.S. health care problems.)
ReplyDeleteWhy are you optimistic? The pharmaceutical industry spent the '90s and '00s pouring tens of billions into new research, and failed utterly. And they actually know how to do research, unlike China's researchers, riddled with political favoritism, plagiarism, and falsified data.
Most of the labor was removed from production long ago, such as agriculture--98%. It's hard to eliminate the remaining 2%. The energy input to producing basic materials such as cement, fertilizer, steel, plastics and fuel to electricity are approaching thermodynamic limits. These processes are mature. TPF growth is probably still occurring mostly in new processes, which has historically been the case.
ReplyDeleteWhen I worked for the world's largest paper company in the 1980s we spent over a billion dollars modernizing old paper mills, some small portion of which included new state of the art computer control. Almost all of the old but modernized mills are now closed. The modern mill built in 1982 was successful because it had better machinery and processes, and did not have high maintenance costs.
David:
ReplyDeleteLast week's Economist made reference to Fernald's latest TFP analysis:
http://www.frbsf.org/publications/economics/papers/2012/wp12-18bk.pdf
Would love your two cents in a future post.
Regards,
JGW