Pages

Thursday, March 31, 2011

Why We Need NGDP Level Targeting

Mark Thoma has an interesting article on the dilemma facing the Fed: does it respond to rising inflation or the anemic economic recovery?  On the one hand, the Fed is concerned about maintaining its inflation fighting credibility and its independence from Congress.  Thus, it wants to be seen as vigilant on the inflation front. On the other hand, it does not want to undermine the economic recovery, as sluggish as it is.  What will it do?  For a number of reasons, Thoma believes the Fed will err on the side of fighting inflation.  This is unfortunate because any honest, fact-based assessment of the economy will show that long-term inflation expectations are well anchored, money demand remains elevated, and there remains much economic slack.

Now no one wants to see the the return of 1970s-type inflation.  But what would be appropriate currently is some catch-up growth in nominal spending (and by implication inflation) to bring nominal income back to trend.  Prior to the recession, households and business made many economic decisions based on an expectation of that nominal income would continue growing at about the same it had over the past few decades.  As is well known, the growth in nominal income collapsed in late 2008, early 2009 and has never recovered.  Consequently, those past decisions are now hindering a robust recovery.  

What is needed then is a monetary policy rule that is systematic and predictable, but at the same time flexible enough to allow nominal spending to return to its trend when it falls off .  There is a name for this: NGDP level targeting.  Note that this approach, if widely understood, would make it easy for the Fed to have some higher inflation during the catch-up stage while keeping long-run inflation expectations anchored. Not only that, such a rule would also anchor nominal spending expectations and thus make it unlikely that there would be a collapse in nominal spending  in the first place.   This is such a no-brainer!  If Congress really wants to reform the Fed this is how it should be done.

P.S. A price level target would also allow for some catchup inflation, but because of how it would handle supply shocks it is better to go with a NGDP level target.

Wednesday, March 30, 2011

Has the Fed Done Too Little or Too Much?

David Leonhardt of the New York Times says too little:
It’s clear which way the Fed has erred recently. It has done too little. It stopped trying to bring down long-term interest rates early last year under the wishful assumption that a recovery had taken hold, only to be forced to reverse course by the end of year.

Given this recent history, you might think Fed officials would now be doing everything possible to ensure a solid recovery. But they’re not. Once again, many of them are worried that the Fed is doing too much. And once again, the odds are rising that it’s doing too little. 
Yes, the Fed fell asleep on the job last year and yes, QE2 was a weak version of what could have been a more effective monetary stimulus program where the price level or nominal GDP level  was targeted. What is not true is that a successful monetary stimulus program will be defined by sustained low long-term interest rates.  A successful monetary stimulus by definition would lead to a robust recovery.  Though this would be initially associated with lower interest rates, the robust recovery should ultimately lead to higher interest rates.  Given the forward looking nature of markets, just the expectation of  an increase in economic activity should put upward pressure on current interest rates.  Initially, this seemed to be happening with QE2: long-term interest rates dropped and then started to increase as growth expectations picked up.  Bernanke, of course, took credit for this development.  Now, long-term rates are nudging down again as growth expectations stall. One could call this a passive tightening of monetary policy.

Update: I meant to include this picture of the the nominal and real (i.e. TIPS) 10-year treasury interest rates.


Dollarizing the Zimbabwe Economy

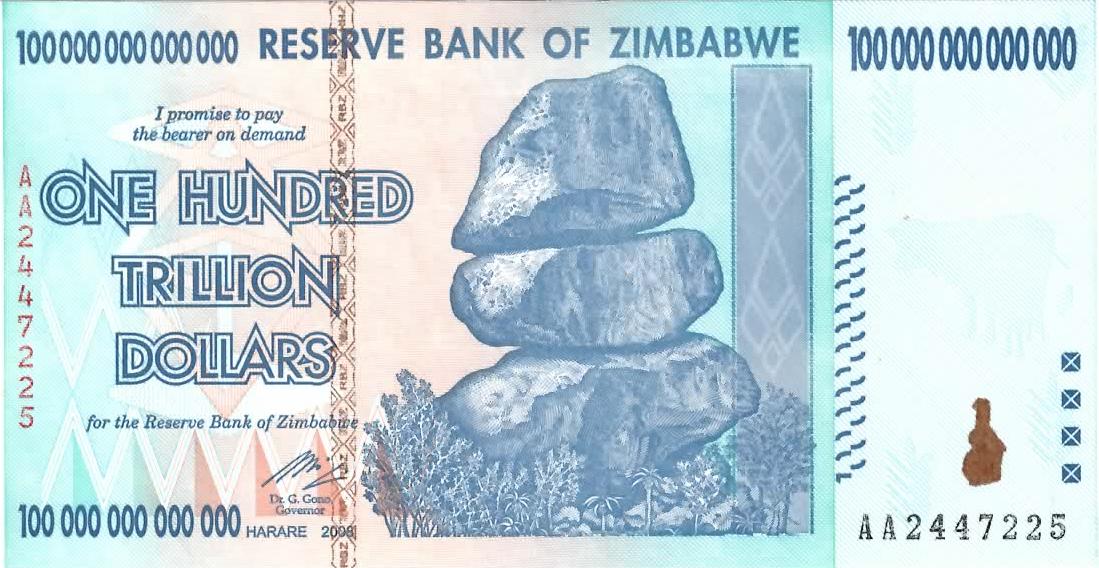
It is hard to believe that it has been  two years since hyperinflation ended in Zimbabwe. In fact, enough time has passed that now the 100 trillion dollar Zimbabwe note shown below is gaining value with collectors.


The reasons the Zimbabwe hyperinflation ended were (1) the country abandoned the production of its own currency and (2) it allowed foreign currencies to be used as legal tender. As result, foreign currencies started functioning as the medium of exchange and goods started appearing in formerly barren stores throughout Zimbabwe. The main foreign currency that is now used in Zimbabwe is the U.S. dollar.

Now dollarization means your monetary policy is tied to the U.S. monetary policy, so it would be interesting to know how QE2 is affecting Zimbabwe.   Also, to earn more dollars Zimbabwe needs to run trade surpluses, but Robert Mugabe's economic policies are not very conducive to that end.   Thus, while dollarization  is tied to the ending of hyperinflation, it could also impose a straitjacket on the economy.  One solution would be to allow a free banking system in Zimbabwe, where the U.S. dollar remains the reserve currency  but banks are allowed to issue their own notes and coins that would be backed by the dollar.  If set up correctly, this free banking system could solve most of the money issues. (See this Federal Reserve Bank of Richmond interview with George Selgin for more on how free banking would work.)

One issue that has emerged is the shortage of coins.  Here is a central banking.com article on the issue (hat tip: Steve Hanke):
Local media reported last month that the Federal Reserve had formally agreed to supply US coins to Zimbabwe, where shopkeepers are suffering a shortage of change. The African economy switched to dollarisation in early 2009 in order to temper a severe bout of hyperinflation.

However, the Fed has not made a formal agreement to supply Zimbabwe with coins. Instead, US government officials are understood to have suggested to the Zimbabweans that if they want coins, they get them through a commercial bank that specialises in wholesale shipment of currency.

The IMF is said to have suggested that Zimbabwe have its own coins but back them with foreign assets.

Zimbabwe agreed to allow businesses to accept multiple currencies, including the dollar, the rand, the pula, the euro and sterling, in January 2009. Dollarisation occurred the following month after the election of Morgan Tsvangirai.
Obviously, there are bigger structural problems to address in Zimbabwe but at least the country has made significant progress reforming its monetary system. 

Tuesday, March 29, 2011

The Three Monetary Systems During the Civil War

Since Paul Krugman is talking about the 150th anniversary of the U.S. Civil War outbreak, it is worth recalling  the great monetary experiments created by the Civil War.   This great event resulted in the establishment of  three monetary regions in the United States: the Greenback monetary system, the Yellowback monetary system, and the Confederate monetary system.

The Greenback monetary system emerged in the East when the gold standard was suspended so fiat currency could be introduced in 1862.  There was no central bank at the time, so the new fiat money   popularly known as the greenback was introduced by the U.S. Treasury.  Ironically, the Treasury Secretary who introduced the Greenbacks, Salmon Chase, would later become Chief Justice of the Supreme Court and rule that the fiat currency was unconstitutional.  The Greenbacks were highly inflationary as seen in the figure below:


Between 1862 and 1865, the price level rose about 60% because of excessive issuance of greenbacks.  Over the next thirty years, the price level decline by almost 50% due in part to a desire to return to the gold standard by 1879.  Doing so required either retiring the greenbacks (done initially) or freezing the stock of greenbacks (done later) and allowing the economy to grow into them. Once the gold standard was resumed, the price level continued to fall as the growth in gold was slower than the growth of the economy.   Eventually, the price level was about where it was prior to the Civil War.  Fortunately, this 30 year run of falling prices was associated with on average rapid real growth, rising real wages, and increasing financial intermediation as noted here. 

The Yellowback monetary system emerged in California during the Civil War.  California never left the gold standard and it dollars remained gold-backed.  These so called yellowbacks floated against the greenbacks until resumption of the gold standard in 1879.  Greenbacks did find their way to California, but were quickly returned to the East as payment.  No greenback banks every took hold in California. Because the Yellowback monetary system continued until 1879, the United States truly was a dual currency nation during this time.  Hugh Rockoff marvels at this dual monetary experiment:
[F]rom 1865 to 1879, when the greenback currency became convertible into gold we have a monetary rarity: a strong political union, untouched by war, with two currencies, greenbacks and yellowbacks, circulating at a floating exchange rate. 
[Update: Here is another Hugh Rockoff paper on the Yellowbacks.]

The Confederate monetary system emerged in the South as a way for the South to gain autonomy and finance the war effort.  The confederate dollar was a fiat money like the greenback and its value ultimately rested on the outcome of the war.  Thus, whenever the South was winning victories the confederate dollar appreciated and when the North was winning it depreciated.  Here is a picture from Feenstra and Taylor International Economics textbook that captures these developments:


Though there were other important monetary changes during Civil War like the introduction of the flawed National Banking System, the three monetary system that emerged during the Civil War was truly a remarkable development.

Core Inflation: Much Ado About Nothing

Ryan Avent is right that we should not get worked up over the possibility that U.S. core inflation appears to have bottomed out.  A potential turn around in core inflation does not negate that fact that the demand for money remains elevated and is hampering a robust recovery in nominal spending.  In addition, forward-looking measures of inflation indicate that long-term inflation expectations remain below the Fed's implicit 2% inflation target as seen in the figure below:

 Source: Cleveland Fed
                                                
Between the elevated demand for money and below-target inflation expectations, it is hard to see why one should get excited about the recent activity in core inflation. These developments, if anything, indicate that monetary policy may still be too tight.

Monday, March 21, 2011

Alex Tabarrok on the Implications of Excess Money Demand

Nick Rowe recently made the case that excess money demand is the fundamental reasons behind the Keynesian and Monetarist theories of recession.  Alex Tabarrok responds that if Nick is correct there should be a rise in barter transactions and the use of alternative currencies.  He shows that there was extensive use of both during the Great Depression.  Tabarrok has a harder time finding evidence of these occurring during the recent recession. Some commentators provide anecdotal evidence that barter trade has risen.  Whether it has or hasn't, the bigger point is that barter and the use of alternative money assets is a way to mitigate the impact of money demand shocks.  Even if the data were to show these mitigaters are not being used, such a finding could simply mean that the recovery will be prolonged rather than being evidence against Nick's hypothesis.  After all, there is compelling evidence of a serious excess money demand problem in the U.S. economy.

P.S. Some places in the Eurozone are using alternative currencies.

Friday, March 18, 2011

The Metric You Should Be Watching But Aren't

I recently made the case that money demand remains elevated and continues to be a drag on the economy.  The  flow of funds data for 2010:Q4 supports this conclusion.  This data shows that the share of nonfinancial private sector assets in liquid form remains relatively high.  Households and firms continue to hold significantly more liquid assets than they did prior to the recession.  The good news is that it the share of liquid assets  dropped slightly in Q4. Presumably, the share of liquid assets continued to decline in early 2011 though recent global events may change that.

Using the Flow of Funds data, the figure below shows for the combined balance sheets of households, non-profits, corporations, and non-corporate businesses the percent of total asset that are highly liquid ones (i.e. cash, checking accounts, saving and time deposits, and money market funds) as of 2010:Q4.  The figure also shows M3 velocity.


Other than the 1995-1999 period, there appears to be a strong negative relationship between these two series. The reason is obvious:  the greater the demand for liquid assets the greater the fall in spending and money velocity.  If we take the year-on-year growth rate of these two series, exclude the  1995:Q1-1999:Q4 period, and throw them into a scatterplot we see this indeed is a strong relationship*:

                                                               
This liquid share seems to provide a good indicator of whether there remains an excess money demand problem that is preventing a robust recovery.  This, then, is the metric you should be watching but aren't.  Until it falls further we can expect nominal spending to remain sluggish.

*The full sample period has a R2 of 42%.