I have not posted here in awhile, so I thought it would be good to share a few recent charts that tell interesting stories.
Central Bank Balance Sheets
First up, are two charts that show the relationship between the size of the central bank balance sheets and inflation rates. The first one shows for the 2010-2019 period the average size of central bank balance sheets as a percent of NGDP plotted against the average core inflation rate. Since larger balance sheets are typically seen as adding more stimulus to the economy, one might expect to see a positive relationship between their size and the inflation rate over this long of an horizon. Instead, we see a negative relationship:
One objection to the above chart is it may be misleading since it is the rate of change in central bank liabilities, not the level, that should drive the inflation rate. To that end, the next chart shows the change in the size of the central bank balance sheets over the same period. The same relationship holds:
Another objection is that these charts simply show central banks responding to the low inflation environments: the lower the inflation rate the bigger the central bank balance sheets. I think that is fair, but again the horizon is an entire decade. Consequently, if the standard theories for QE such as the portfolio balance channel and the signalling channels hold, then we should expect to eventually see something different than a negative relationship. And 10 years seems long enough for 'eventually' to come to fruition.
My explanation for these charts, forthcoming in a working paper, is that something else is driving both the low inflation and the expanding central bank balance sheets.
NGDP Gap
Our 2020 Q3 report for the NGDP Gap came out recently. Here is the key takeaway:
[the] NGDP gap of −4.77 percent indicates that the dollar size of the economy is still significantly smaller than prepandemic expectations. Specifically, the neutral level of NGDP was $22.22 trillion in the third quarter of 2020, whereas actual NGDP came in at $21.16 trillion. That is a shortfall of $1.06 trillion, which is a vast improvement over the previous quarter’s shortfall of $2.57 trillion, but still a sizable hole to fill in the economy. This trillion-dollar hole means that both aggregate spending and income are still falling short of their prepandemic trend levels.
Below are the relevant charts. Note, you can now get the neutral NGDP and NGDP gap measures in both Haver and Macrobond data!
Real Interest Rates Determination
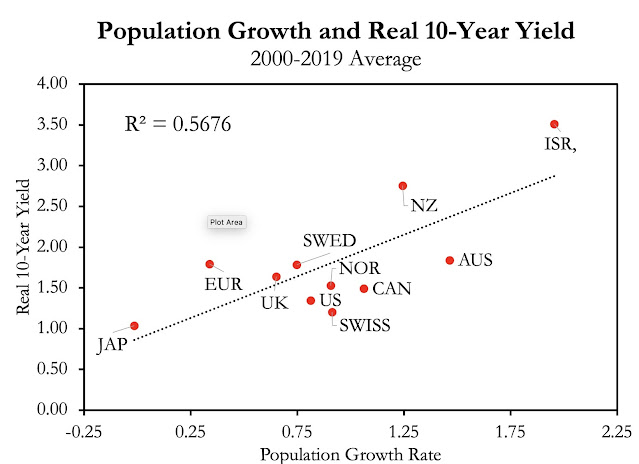
I was recently embroiled in a debate over what determines the path of real interest rates. The debate was whether the standard desired saving - desired investment (S-I) theory of interest rates or the liquidity preference theory best explains the path of real interest rates. The former looks to the fundamentals of time preferences, population growth, and expected economic growth as the explanation for real interest rates. The latter view looks to money markets and the expected interest rate path of the central bank as the explanation. My take has been the fundamentals view is more important over the longrun while the money view is more important in the shortrun.
Here are some charts I made that look at the longrun and show that fundamentals are, indeed, tied to real interest rate formation in advanced economies. Specifically, population growth rates and fertility rates are associated with the 10-year real yield. I created these charts after chatting with Matt Yglesias about his book "One Billion Americans" for the podcast. He verbally sketched out these scatterplots and I was curious to see if they held up in the data. They did!
FOMC Humor
Finally, here is my attempt at the two choice meme as it relates to Treasury Secretary Mnuchin's decision to pull back the Treasury backstop funds for the Fed's 13(3) facilities. I joked that maybe the Secretary was attempting to force Congress to be more active on relief and rely less on the Fed. Looks like I was not too far off. Anyways, the tension between asking the Fed to do more with 13(3) facilities and asking Congress to do more is real.


