Pages

Showing posts with label Recession. Show all posts

Thursday, September 2, 2010

What Can Be Done to Hasten the Recovery?

I believe the Fed can and should be doing more to create a more stable macroeconomic environment.  There is much they can yet do to stabilize aggregate spending and improve economic certainty.  However, even if we were to get this from the Fed it still would not solve all our economic problems. We are in the midst of a massive deleveraging cycle by households and unless something radical happens like swapping  the underwater portion of household mortgages for equity  this process will probably take years to unfold. Ken Rogoff reminds us of this point in a recent article:
What more, if anything, can be done? The honest answer – but one that few voters want to hear – is that there is no magic bullet. It took more than a decade to dig today’s hole, and climbing out of it will take a while, too. As Carmen Reinhart and I warned in our 2009 book on the 800-year history of financial crises (with the ironic title “This Time is Different”), slow, protracted recovery with sustained high unemployment is the norm in the aftermath of a deep financial crisis.
The only palliative he sees is higher inflation:
Given the massive deleveraging of public- and private-sector debt that lies ahead, and my continuing cynicism about the US political and legal system’s capacity to facilitate workouts, two or three years of slightly elevated inflation strikes me as the best of many very bad options, and far preferable to deflation. While the Fed is still reluctant to compromise its long-term independence, I suspect that before this is over it will use most, if not all, of the tools outlined by Bernanke.
I too don't want to comprise the Fed's long-run inflation credibility.  That's why I want a NGDP  level target (my first choice) or price level target (my second choice... I really don't like this one but I will settle for it). It would create some higher (catch-up) inflation until we hit some target level and stabilize thereafter. If this policy were made explicit it would do much to stabilize economic expectations, a big plus in our current mess.  Again, this will not fix our structural problems, but it would create a more stable macroeconomic environment in which to make the needed structural adjustments.  Now if we could get more discussion on  proposals to hasten the restoration of household balance sheets, such as the one to swap underwater mortgage debt for equity, maybe the structural adjustments could  be expedited too.

Tuesday, July 20, 2010

I Hope He is Wrong...

But I fear that Roger Lowenstein and his assessment on how long it will take the U.S. economy to return to normal may be right.  The crux of his analysis is that household balance sheets were decimated in this recession and to fix them will take years.  As part of this slow process households are deleveraging and saving more.  Though needed, these structural adjustments imply sluggish growth. And if this process takes years as indicated by Lowenstein then we are looking at sluggish growth for some time.  Here is Lowenstein:
Eschewing trips to the mall, Americans are paying off credit-card balances and home-equity lines. Despite low rates, mortgage demand has plummeted.

Some people have no choice but to pare their debts (indeed, some are being foreclosed on). For others, call it morning-after sobriety or late-blooming prudence. Losing income tends to bring on a case of the nerves, and half of American workers have suffered a job loss or a cut in hours or wages over the past 30 months. And, need we add, people’s stock portfolios are not what they were.

The economic term is “deleveraging”; it means that, as opposed to the normal state of affairs, in which, each quarter, people borrow more money and banks issue more loans, credit in the economy is shrinking. Remarkably, this deleveraging has been going on for nearly two years.
[...]

To return to the status quo of before the housing boom — say, back to debt to income ratios prevailing in 2000 — it would take five more years of deleveraging at the current rate. Deleveraging cycles are rare, notes David Rosenberg, an economist with the Toronto firm Gluskin Sheff, but five to seven years is typically what they take.
I really hope this assessment is wrong.  Looking to the data, though, on household balance sheets does seem to lend itself to Lowenstein's dour assessment. Below is household net worth (i.e. assets minus liabilities) as a percent of disposable income up through 2010:Q1.  The data comes from the Flow of Funds table B.100.  (Click on figure to enlarge.)


Household net worth is close to what it was in the late 1980s, early 1990s.  Obviously, most of the fall in household net worth has come from a decline in asset values. Liabilities have not change much.  This is very evident in if one looks specifically at residential real-estate assets versus residential mortgage debt. Truly this is the revenge of the balance sheets.

Tuesday, June 29, 2010

Cleveland Fed: It's Not Looking Good

The Cleveland Fed has launched a new website that will provide on a monthly basis estimates of expected inflation over various horizons. These estimates are supposed to be cleaner than those coming from Treasury inflation-protected securities (TIPS) which are contaminated by risk premia. The model that is the basis for these estimates can also be used to derive real interest rates and an inflation risk premium. This is a great addition to the universe of online economic data and the Cleveland Fed should be commended for providing it to the public.

The numbers for June 2010 are not pretty. Here is the lead paragraph:
The Federal Reserve Bank of Cleveland reports that its latest estimate of 10-year expected inflation is 1.84 percent. In other words, the public currently expects the inflation rate to be less than 2 percent on average over the next decade.
It gets worse. This 1.84% is down from the previous month as is all yearly horizons of inflation expectations. This can be seen in the following Cleveland Fed figure. This figure shows the expected inflation over maturities ranging from 1 to 30 years:

The first of these data points says that the market expects inflation to be 1.34% over the next year. A closer look at the data for the whole year indicates this broad decline in inflationary expectations is not a one-time drop. Inflation expectations are down for the first half of this year. These findings confirm the point I have been making with TIPS data: the market expects aggregate demand to slow down over the next year. And the Fed's failure to stabilize these expectations means that monetary policy is effectively tightening.

Speaking of tightening, below is the Cleveland Fed's estimates of the 1-month real interest rate that comes from the same model generating the expected inflation series. (The red highlight and related commentary are mine):

So real interest rates spiked in November 2008 and stayed elevated through March 2009. This bit of evidence lends support to Scott Sumner's claim that monetary policy effectively tightened here and helped usher in the Great Recession.

Go check out the website.

Thursday, June 24, 2010

Why Isn't the Fed Doing More?

Houston, we have a a problem. It appears that that total spending in the U.S. economy is slowing, if not outright contracting. Retail sales fell in May while in April personal consumption expenditures stalled. In addition, housing starts and homes sales plummeted in May. Meanwhile, the MZM measure of the money supply has been declining since late 2009. Since these developments indicate that both money (M) and velocity (V) are declining, it is safe to conclude that aggregate demand (PY) is falling too (i.e. MV = PY). Given these developments why isn't the Fed doing more to help the U.S. economy? Surely, it can stabilize MV. Here is what three observers had to say in response to this question:
1. David Leonhardt. Financial markets are fragile and the Fed does not want to upset the market's confidence in the U.S. government by further easing of monetary policy. More monetary stimulus might just be the trigger to spook markets into dumping the dollar and U.S. debt.

2. Daniel Gross: The Fed is exhausted from its grand experiments in central banking--it has already drop interest rates to 0%, created new lender-of-last-resort facilities, and blew up its balance sheet--and is puttering out from sheer exhaustion.

3. Ryan Avent: There is division within the Fed on whether further monetary stimulus is really necessary. Moreover, even if there were no internal divisions, the Fed leadership may still be reluctant to act because it fears doing so may cause long-run inflation expectations to become unanchored.
There may be some truth in these responses, but let me add two more potential reasons for the Fed's inaction. First, the Fed may believe that some of the problems in the economy may be real in nature rather nominal and if so there is little monetary policy could do to improve matters. For example, if the Fed believes the high level of unemployment is mostly of the structural kind rather than cyclical then there is only a downside to further easing. This probably isn't a big factor--see the Atlanta Fed and the Ryan Avent on this issue--in the Fed officials' thinking but on the margin it may give them another reason to be reluctant to ease.

A second reason may be the Fed is looking at the wrong indicators in determining the stance of monetary policy and thus mistakenly thinks it is being highly accommodative when in fact it is not. In particular, the Fed may believe it is already doing enough by holding its target interest rate, the federal funds rate, close to 0%. That is the impression one gets when reading statements like this one from the FOMC press release for the June 23, 2010 meeting:
The Committee will maintain the target range for the federal funds rate at 0 to 1/4 percent and continues to anticipate that economic conditions, including low rates of resource utilization, subdued inflation trends, and stable inflation expectations, are likely to warrant exceptionally low levels of the federal funds rate for an extended period.
Observers, however, like Michael Belongia, Scott Sumner, and Nick Rowe have been arguing for some time that a low federal funds rate can be a misleading indicator of the stance of monetary policy. Even if one sticks with the federal funds rate as an indicator, then folks like Glenn Rudebush would point out that it would need to be about -3% (which it can't because it can't below zero) to be adding the right amount of stimulus. The bottom line is that the Fed may be inadvertently tightening by sitting on a 0% interest rate target and doing nothing.

This unintended tightening of monetary policy seems to be the message coming from the difference between the nominal interest rate on the 5-year Treasury and the real interest rate on the 5-year Treasury inflation protected security (TIPS). This difference or spread amounts to the markets expectation of future inflation. Below, this spread is graphed for the first half of this year up through June 24, 2010.


There is a clear downward trend in inflation expectations. Given the developments mentioned above and the other looming economic problems (Eurozone uncertainty, austerity talk, weak household balance sheets, etc.) the most obvious way to interpret this decline is that the markets expect aggregate demand to weaken going forward. Now it is possible that an increase in the liquidity premium is driving some of this decline, but I am not convinced it undermines my interpretation for several reasons. First, such a change in the liquidity premium would itself be driven by the recent uptick in perceived market risk, but that development has only happened in the last month or so as seen in the figure below. The decline in expected inflation has been going on for six months.


Second, even if spreads are driving the some of the more recent declines in expected inflation one must ask whether the spreads would be going up in the first place had the Fed been stabilizing inflation expectations (and thus aggregate demand) all along. Any way you slice the data it ain't a pretty picture.

So what do you think? Why isn't the Fed doing more?

Update I: Scott Sumner says Ben Bernanke is trying to do more, but is constrained by internal divisions at the Fed. Chalk one up for Ryan Avent.

Update II: The expected inflation chart was updated one day to June 24.

Friday, March 26, 2010

"Deposit Insurance" for the Shadow Banking System

Here are some more thoughts inspired by Gary Gorton's work and discussions at the Economics Blogger Forum. During the Great Depression of the 1930s there were runs on the banking system. These panics were based on depositors rushing to get their money back from the banks. The federal government response was to create deposit insurance. This response worked but it also created moral hazard problems that, in turn, required more government regulation.

During the Great Recession of the late 2000s something similar happened. There was a run on the shadow banking system in the repurchase agreement (repo) market by institutional investors and nonfinancial firms. Repos represent a liability for the shadow banking system just as deposits do for the traditional banking system. According to Gorton, the repo market is around $12 trillion in size (compared to about $10 trillion in assets for the traditional U.S. banking system) so this was a major bank run. Like deposit holders during the Great Depression, repo holders in this crisis wanted their money back and could get it by (1) forcing the shadow banks to take a haircut on the collateral used in repos or (2) not renewing the repos . As a result, repo markets began freezing up and threatened the shadow banking system. Since the shadow banking system is a conduit for funding the traditional banking system, financial intermediation in general became threatened (See Gorton for more details). The official response to this banking panic was for the Federal Reserve to create liquidity programs to effectively unthaw the repo market. Like deposit insurance in the 1930s, this government intervention stopped the run on the shadow banking system. Now that these liquidity facilities have been tested and shown to work, there is an expectation they will be used again if needed. And like the deposit insurance for the traditional banking system, this modern form of "deposit insurance" for the shadow banking system is bound to create moral hazard problems that will ultimately lead to more government regulation. These are interesting parallels.

The emergence of the shadow banking system, therefore, not only has implications for the correct measure of the money supply, but also for what will be the new moral hazard and government regulation of the financial system.

Friday, February 26, 2010

A Fat-Tail Event for U.S. Government Financing?

I recently argued that those observers who only see long-term structural budgetary problems, fail to consider the potential for a fat-tail event adversely affecting U.S. government financing in the near term. Clive Crook considers this possibility by asking whether the U.S. government might soon face a crisis of confidence like that of Greece:
It depends on what you mean by "soon." At the moment, the United States is borrowing with no great sign of stress. Far from coming under pressure, the dollar is still strong, and the cost of U.S. government borrowing (the interest rate on Treasury bonds) shows no sign of spiking. Greece, to be sure, has some problems all its own. Where it leads, the United States need not follow. Yet one should not dismiss the parallel too blithely. Sentiment in financial markets can change abruptly, and the differences between Greece's financial condition and America's are not as vast as one would wish.
Read the rest here.

Thursday, February 25, 2010

Revenge of the Balance Sheets

The U.S. economic crisis has been called by some observers a balance sheet recession given the deterioration of the balance sheets in the banking system and the household sector. The U.S. banking system's balance sheets certainly took a beating during the crisis, but some progress has been made in repairing them. The IMF, for example, shows in its latest Global Financial Stability Report (chapter 1, pp. 7-9) that 60% of needed writedowns of U.S. bank assets had already occurred by late 2009. The November 2009 OECD Economic Outlook notes similar improvements, including sizable capital injections. Of course, there are still more writedowns to do, bank lending is still anemic, and much of the banking system's balance sheet problems have only been transferred to the Fed's balance sheet. Still, there has been some meaningful repair to banking system's balance sheet and that is more than can be said for the household balance sheet. This can be seen by examining the flow of funds data for the households, specially household net worth (i.e. household assets minus household liabilities). The figure below graphs this series as a percent of disposable income (click on figure to enlarge):


Note that household net worth as a percent of disposable income reached its lowest point during the crisis in 2009:Q1 with a value of about 450%. At this point, household net worth was put back to where it was in late 1985! For the latest observation of 2009:Q3 household net worth is about 485%, which is approximately where it was on average for the entire 1987:Q1-1993:Q1 period. The bottom line is that household balance sheets have been put back almost two decades. This is both amazing and alarming.

Now repairing household balance sheets will not be an easy task. Here are the options: First, reduce household liabilities by (1) writing down claims against households and/or (2) wide-scale household bankruptcy. Second, increase household assets through (3) a new asset boom cycle and/or (4) increased household saving. Options (1) and (2) are undesirable since they would add further disruptions to an already weakened financial system. Option (3) seems unlikely unless there is some truly new innovation (e.g. green energy) that takes off. That leaves option (4) which is already happening as the U.S. personal saving (and overall private saving) rate has increased since the downturn. This approach to improving household balance sheets , however, creates its own set of problems. First, it is not a quick fix. It may take years this way to fully repair household balance sheets that have been put back two decades. Second, as noted by Martin Wolf, the higher household saving means a drop in total spending and ultimately broader economic activity. As a result, government spending has stepped in to fill the aggregate demand gap by running budget deficits. However, given that the decline in spending by households may last years the aggregate demand gap spending by government may also last years. This , in turn, raises the specter of sovereign bankruptcy. In short, in the absence of another asset boom the U.S. economy faces the possibility of wide-scale private sector bankruptcy or public sector bankruptcy. Martin Wolf agrees as does Paul Krugman. You can run but you cannot hide from the problems with household balance sheets.

Update:To be clear, U.S. sovereign bankruptcy may mean inflating away some of its debt. There need not be an explicit default.

Friday, October 2, 2009

Was it Nominal or Real?

Scott Sumner has been 
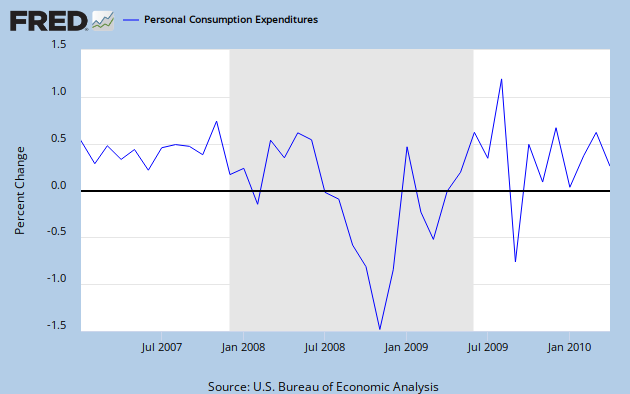
arguing for some time that the current recession mutated from a mild downturn in early 2008 to a sharp contraction in late 2008 and early 2009 because of a nominal shock, not a real one. Specifically, he has been making the case that monetary policy effectively tightened in late 2008 and, as a result, nominal spending collapsed and pulled down an already weakened economy. According to this view, real shocks like the one coming from the financial crisis or the spike in oil prices, which were important in starting the recession, cannot explain the severity of the downturn that began in late 2008. As readers of this blog know, I have been sympathetic to this view as can be seen here and here. Many observers, however, do not buy it or if they do find it plausible refuse to endorse it due to the lack of empirical evidence. This post is my attempt to shed some light on this debate by using some rigorous (albeit imperfect) empirical methods to tease out what shocks drove the collapse in nominal spending. This essay is in some ways an extension of what I did earlier this week, but it is motivated more by the need for empirical evidence. I won't claim it is conclusive, but it is a start.

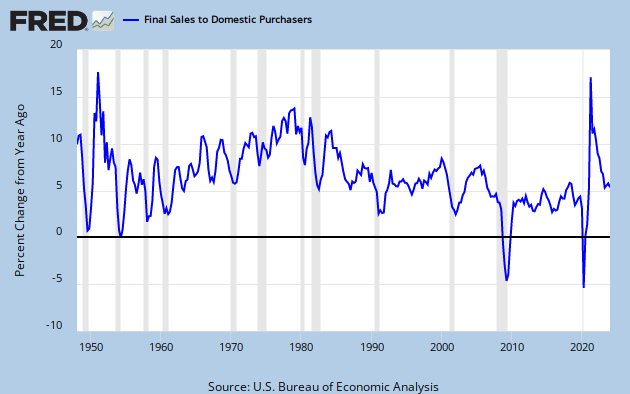
In order to uncover the shocks that drove the collapse in nominal spending, I turned to a vector autoregression that as a base line model included expected future inflation, nominal spending, and spreads on corporates yields. The expected future inflation data comes from the Philadelphia Fed's survey of economic forecasters, nominal spending is final sales to domestic purchasers, and corporate spreads are the difference between the yield on BAA and AAA corporate bonds. The reasons for using these variables is as follows. First, Scott has been arguing that the collapse of expected future inflation in late 2008 reflected an effective tightening of monetary policy that translated into reduction of current nominal spending. In other words, the market saw deflationary pressures on the horizon and immediately cut back on spending. Second, the corporate spreads provide a convenient measure of the financial crisis and should control for any collapse in nominal spending coming from a negative financial shock. The data for these variables run from 1971:Q1 thru 2009:Q2.

The VAR was specified and estimated in a conventional manner.* With the VAR estimated I then did a historical decomposition which decomposes or attributes the forecast error for a particular series--in this case the nominal spending growth rate--into shocks or non-forecasted movements in other series. In the baseline model, the other series are expected future inflation and the financial crisis. In other words, this exercise shows how much of the non-forecasted movements in nominal spending can be explained by non-forecasted movements in expected future inflation. The figure below graphs the results of this exercise. In this figure, the other series contribution to the forecast error--the difference the actual and forecasted nominal spending growth rate--is shown by the dashed lines. The closer a dashed line is to the solid red line the more of the forecast error is explained by that shock: (Click on figure to enlarge)


In this figure we see that both the expected inflation shock and financial system shock were important in the collapse of nominal spending. At its peak, the expected inflation shock explains 50% of the decline in the nominal spending shock during the time in question. This baseline model, however, ignores the oil shock and its potential contribution to the collapse in nominal spending. The VAR was reestimated, therefore, with oil prices and generated the following results: (Click on figure to enlarge)

Here the expected inflation shock is still important, but now only explains at most 31% of the decline in nominal spending. The financial shock becomes more important and oil itself is non-trivial in explaining the decline in nominal spending.

One problem with the above analysis is that it assumes the change in expected inflation is a good measure of the stance of monetary policy. I have argued elsewhere on this blog that a better measure is the difference between the nominal spending growth rate and the federal funds rates. I redid the model with this measure of the stance of monetary policy and this is what I found: (Click on figure to enlarge)


With this measure, monetary policy explains 95% of the decline in nominal spending for 2008:Q3, 78% in 2008:Q4, and 31% in 2009:Q1. This last figure confirms Scott's story. Of course, it assumes the monetary policy measure outlined above is actually measuring the stance of monetary policy. Note everyone will agree, but I certainly believe it is. To summarize the findings from the above figures the table below list the % contribution to the decline in nominal spending growth rate coming from the different measures representing monetary policy:


*The VAR had 5 lags to remove serial correlations and the variables were all in rate form so no unit root problem.

Update: Scott Sumner responds here.

Thursday, September 17, 2009

Does the Equation of Exchange Shed Any Light on the Crisis?

James Hamilton thinks the answer is no. In his reply to Scott Sumner's lead article at Cato Unbound, he questions Sumner's use of the identity MV = PY to explain the collapse of nominal spending over the past year. (In this equation M = money supply, V = velocity or the average number of times a unit of money is spent, P = price level, Y = real GDP, and PY = nominal GDP.) Hamilton contends the only meaningful use of the identity is to determine velocity (i.e. V=PY/M) and even then it is not totally reliable since it can vary based on the measure of money one uses. I believe, however, Hamilton under appreciates the insights this identity can shed on the crisis. It may not provide precise policy recommendations, but it does provide a starting point from which to think analytically and empirically about recent economic developments.

So what does this identity tells us about the crisis? To answer this question we first need to expand the identity a bit. To do so, note that the money supply is the product of the monetary base, B, times the money multiplier, m or

M = Bm.

Now substitute this into the equation of exchange to get the following:

BmV = PY.

Now we have an identity that says the sources of nominal spending are the monetary base, the money multiplier, and velocity. With this identity in hand we can asses the contribution of these three sources to the dramatic decline in nominal spending in the past year. Using MZM as the measure of money (see here for why MZM is preferred over M1 and M2) and monthly nominal GDP from Macroeconomic Advisers to construct velocity, the three series are graphed below in levels (click on figure to enlarge):


This figure indicates that declines in the money multiplier and velocity have both been pulling down nominal GDP. The decline in the money multiplier reflects (1) the problems in the banking system that have led to a decline in financial intermediation as well as (2) the interest the Fed is paying on excess bank reserves. The decline in the velocity is presumably the result of an increase in real money demand created by the uncertainty surrounding the recession. This figure also shows that the Federal Reserve has been significantly increasing the monetary base, which should, all else equal, put upward pressure on nominal spending. However, all else is not equal as the movements in the money multiplier and the monetary base appear to mostly offset each other. Therefore, it seems that on balance it has been the fall in velocity (i.e. the increase in real money demand) that has driven the collapse in nominal spending.

To get a better sense of what is happening with theses series note that log of the expanded equation of exchange can be stated as follows:

B+m+V = P+Y,

Now if we take first differences of the the quarterly log values of the series in the above identity we get a quarterly growth rate approximation. (Note, this approximation is not very good for large differences like the one for the monetary base in 2008:Q4.) Below is a table with the results in annualized values (Click to enlarge):


This table confirms what we saw in the levels: a sharp decline in velocity appears to be the main contributor to the collapse in nominal spending in late 2008 and early 2009 as changes in the monetary base and the money multiplier largely offset each other. It is striking that the largest run ups in the monetary base occurred in the same quarters (2008:Q3, 2008:Q4) as the largest drops in the money multiplier. If the Fed's payment on excess reserves were the main reason for the decline in the money multiplier and if the Fed used this new tool in order to allow for massive credit easing (i.e. buying up troubled assets and bringing down spreads) without inflation emerging, then the Fed's timing was impeccable. Unfortunately, though, it appears the Fed was so focused on preventing its credit easing program from destabilizing the money supply that it overlooked, or least underestimated, developments with real money demand (i.e. velocity). As a consequence, nominal spending crashed.

Now maybe this is self evident to some, but I find the above information from the equation of exchange useful as a starting point for discussing what went wrong and where to go from here.

Monday, August 24, 2009

Dark Clouds on the Horizon?

Nouriel Roubini says there may be trouble ahead:
There are also now two reasons why there is a rising risk of a double-dip W-shaped recession. For a start, there are risks associated with exit strategies from the massive monetary and fiscal easing: policymakers are damned if they do and damned if they don’t. If they take large fiscal deficits seriously and raise taxes, cut spending and mop up excess liquidity soon, they would undermine recovery and tip the economy back into stag-deflation (recession and deflation).

But if they maintain large budget deficits, bond market vigilantes will punish policymakers. Then, inflationary expectations will increase, long-term government bond yields would rise and borrowing rates will go up sharply, leading to stagflation.

Another reason to fear a double-dip recession is that oil, energy and food prices are now rising faster than economic fundamentals warrant, and could be driven higher by excessive liquidity chasing assets and by speculative demand. Last year, oil at $145 a barrel was a tipping point for the global economy, as it created negative terms of trade and a disposable income shock for oil importing economies. The global economy could not withstand another contractionary shock if similar speculation drives oil rapidly towards $100 a barrel.
If that were not enough, Andy Xie shares a similar outlook.

Get Ready for Interest Rate Shocks

One of the important messages coming out of the central banker's annual retreat in Jackson Hole, Wyoming is that once the crisis is over the Federal Reserve's (Fed) tightening of monetary policy may be abrupt. If so, increases in short term interest rates will not be gradual but jarring. The reasoning behind this approach, as I understand it, is that (1) since there could be political pressures to monetize the government debt and (2) given the large amount of existing liquidity that needs to be drained the Fed's exit strategy needs to be unmistakably clear in communicating that it will not tolerate the unanchoring of inflationary expectations. Here is the New York Times:
A growing number of economists and some Fed officials say the shift to tighter monetary policies and higher interest rates, though unlikely to start until at least the middle of next year, may have to be much more abrupt than normal if they are to prevent inflation two or three years from now.

“When you get into a crisis like this, gradualism is not the right strategy,” said Frederic S. Mishkin, an economist at Columbia University who was a Fed governor from 2006 until 2008. “Of course, when things turn around, you have to be aggressive in the other direction.”
And here is the Wall Street Journal on the talk Carl Walsh gave at the retreat:
[O]nce the Fed does start raising the federal-funds rate out of its current record-low range near zero, "it should be increased quickly," Mr. Walsh argued. "There is no support for raising rates at a gradual pace once the zero rate policy is ended."
This rhetoric is sounding so Paul Volker-like. It remains to be seen, though, whether the Fed could actually make such abrupt changes in monetary policy. There are two major obstacles to such an approach. First, now that the global economy has become addicted to a low interest rate policy, any drastic tightening will amount to a painful interest rate shock. Second, tightening policy may make the budget deficits even larger and make it more costly to finance, a point alluded to in the New York Times article:
Indeed, the Federal Reserve’s “exit strategy” could lead to a clash with the Obama administration. The White House plans to release its newest budget estimates next week, and administration officials said that the 10-year deficit will rise to $9 trillion — a big jump from its earlier estimate of $7 trillion.

[...]

In the future, Fed officials could feel more pressure to further tighten monetary policy as a way of countering the government’s deficit spending. The immense amount of borrowing could push up long-term interest rates, if foreign investors balk at buying up United States debt.
Of course, all of this analysis assumes the Fed knows when the time is right to begin its exit strategy. As noted in my previous post, however, even this assumption is questionable. Fed policy over the next few years should be a doozy to watch.

Monday, August 17, 2009

Hope and Concern for the Global Economy

This Economist's article gives us hope that Asia may pull the global economy out of its slump:
IT NEVER pays to underestimate the bounciness of Asia’s emerging economies. After the region’s financial crisis of 1997-98, and again after the dotcom bust in 2001, outsiders predicted a lengthy period on the floor—only for the tigers to spring back rapidly. Earlier this year it was argued that such export-dependent economies could not revive until customers in the rich world did. The West still looks weak, with many economies contracting in the second quarter, and even if America begins to grow in the second half of this year, consumer spending looks sickly. Yet Asian economies, increasingly decoupled from Western shopping habits, are growing fast.

The four emerging Asian economies which have reported GDP figures for the second quarter (China, Indonesia, South Korea and Singapore) grew by an average annualised rate of more than 10% (see article). Even richer and more sluggish Japan, which cannot match that figure, seems to be recovering faster than its Western peers. But emerging Asia should grow by more than 5% this year—at a time when the old G7 could contract by 3.5%.
The article goes on to say the most important part of the Asian recovery is an increase in domestic spending. I hope this Asian spending surge is sustainable because it is needed to offset what Ambrose Evans-Pritchard says is an alarming amount of excess capacity in the global economy:
Too many steel mills have been built, too many plants making cars, computer chips or solar panels, too many ships, too many houses. They have outstripped the spending power of those supposed to buy the products. This is more or less what happened in the 1920s when electrification and Ford’s assembly line methods lifted output faster than wages. It is a key reason why the Slump proved so intractable, though debt then was far lower than today.

Thankfully, leaders in the US and Europe have this time prevented an implosion of the money supply and domino bank failures. But they have not resolved the elemental causes of our (misnamed) Credit Crisis; nor can they.

Excess plant will hang over us like an oppressive fog until cleared by liquidation, or incomes slowly catch up, or both. Until this occurs, we risk lurching from one false dawn to another, endlessly disappointed.

Justin Lin, the World Bank’s chief economist, warned last month that half-empty factories risk setting off a “deflationary spiral”. We are moving into a phase where the “real economy crisis” bites deeper – meaning mass lay-offs and drastic falls in investment as firms retrench. “Unless we deal with excess capacity, it will wreak havoc on all countries,” he said.

Mr Lin said capacity use had fallen to 72pc in Germany, 69pc in the US, 65pc in Japan, and near 50pc in some poorer countries. These are post-War lows. Fresh data from the Federal Reserve is actually worse. Capacity use in US manufacturing fell to 65.4pc in July.
Nouriel Roubini provides further words of caution about the recovery of the global economy.

Monday, June 22, 2009

The Deflation Threat of 2009 vs. The Deflation Threat of 2003

Over the weekend, Alan Blinder in the New York Times and Ambrose Evans-Pritchard in the Telegraph both noted that that the real threat currently facing the U.S. economy is not inflation but deflation. One only needs to look at the large negative output gap, the dramatic collapse in nominal spending, or the declines in velocity and the money multiplier to see that there is merit to their claims. There is a real deflationary threat lingering over the U.S. economy in 2009.

With that said, there is an unfortunate irony to the current deflationary threat that can be traced back to 2003. Back then there was another deflationary threat that concerned the Federal Reserve (Fed). As a result, the Fed lowered the federal funds rate to what was at the time an historically low value of 1%. It held this short-term interest rate there for a year before gradually tightening. As we now know, this excessively-loose monetary policy was an important contributor to the buildup of the economic imbalances that eventually led to this economic crisis, including the current deflationary threat. In short, the fear of deflation in 2003 laid seeds for the deflationary threat of 2009.

What makes this an unfortunate irony is that this chain of events did not have to happen. For there was a big difference between the deflationary pressures in 2003 and the ones in 2009. In 2003 the deflationary pressures were driven by rapid productivity gains and were benign in nature. Moreover, nominal spending or aggregate demand was rapidly growing. There simply was no evidence of a malign deflationary threat as there is today and thus, there was no need for the Fed to drop interest rates so low for so long. I have documented these developments in previous posts, but here are a few key graphs that make the case. First, here is the year-on-year productivity growth rate plotted against the ex-post real federal funds rate (click on figure to enlarge):


This pictures shows that Fed was pushing the real federal funds rate into negative territory just as productivity was increasing. The next figure shows final sales to domestic purchasers, a measure of nominal spending in the United States plotted against the federal funds rate. The year 2003 is marked off by the dotted lines (click on figure to enlarge):


No indication here of a collapse in nominal spending in 2003. (There was the weak labor market in 2003, but as I have argued before the slow recovery of employment can most likely be traced to (1) the robust productivity gains and (2) the inordinate substitution of capital for labor given the low interest rates of the time.) What this all means is that the Fed's misreading of the deflationary pressures in 2003 contributed to the creation of deflationary pressures of 2009.

My hope is is that moving forward the Fed and other monetary authorities will be more careful in assessing the sources of and responding to the deflationary pressures.

Tuesday, June 16, 2009

Balancing Deficit Concerns Against the Need for Stimulus

Scott Sumner provides some fresh perspective:

We do need much smaller budget deficits ASAP, but we also need much more stimulus. How do we achieve these two seemingly incompatible goals? With a much more aggressive policy of monetary stimulus we can get faster NGDP growth, and this will reduce fiscal deficits in two ways:

1. The automatic stabilizer part of the deficit will shrink naturally.

2. There will be less need for discretionary fiscal stimulus.

Yet another reason for monetary policy to target nominal income. Read the rest of Scott's post here.

The Economic Crisis in One Equation

I just finished reading Tyler Cowen and Alex Tabarrok's new chapter on the dynamic aggregate demand-aggregate supply model. It was a great read and started me thinking about how the current economic crisis could be viewed in light of the equation of exchange. Interestingly, just as I started thinking along these lines I saw that Nick Rowe had a post praising the equation of exchange. With this inspiration, it seemed only natural for me to go ahead and attempt to frame the current economic crisis in terms of the equation of exchange.

Let me begin by defining the equation of exchange:

MV = PY,

where M is the money supply, V is the velocity or average number of times a unit of money is spent, P is the price level, and Y is real GDP. This identity states that the money supply multiplied by the number of times it is spent must be equal to the current dollar value of the economy. This identity can be further decomposed by noting that the money supply is the product of the monetary base, B, times the money multiplier, m:

M = Bm

or

BmV = PY

With this equation of exchange we can now consider the economic crisis. First, assume that causality typically flows from the left-hand side of the equation to the right-hand side. It is well known what is happening on the right-hand side: both nominal and real GDP are plunging. Here is a figure showing monthly values for both series as well as the trend for 2003-2007. The data comes from Macroeconomic Advisers. (Click on figure to enlarge.)


So what is driving these declines? From the left-hand side of the equation we know it could be (1) change in the monetary base, (2) a change in the money multiplier, a (3) a change in velocity, or (4) some combination of the above. Using the MZM measure of the money supply (see here for why MZM is preferred over M1 and M2), the figure below shows what has happened to the monetary base, the money multiplier, and velocity (Click on figure to enlarge):


Source: Macroeconomic Advisers, St. Louis Federal Reserve

This figure shows that that declines in the money multiplier and velocity have both been pulling down nominal GDP. The decline in the money multiplier reflects (1) the problems in the banking system that have led to a decline in financial intermediation as well as (2) the interest the Fed is paying on excess bank reserves. The decline in the velocity is presumably the result of an increase in real money demand created by the uncertainty surrounding the recession. This figure also shows that the Federal Reserve has been trying to offset these moves by significantly increasing the monetary base. Therefore, the large increase in the monetary base has been far from inflationary; rather it is fighting off the deflationary forces created by by the declines in the money multiplier and velocity.

This figure also has several policy implications. First, remove any obstacles that hinder the money multiplier. That means cleaning up the bank's balance sheets and dropping the Fed's payment of interest on excess reserves. Unfortunately, neither of these seem imminent. Second, adopt policies that will increase velocity. As noted by Alex Tabarrok this is where fiscal policy could potentially play a role. So far, though, it appears from the figure that the current stimulus package is failing to arrest the decline in velocity. (One could ague, though, it is higher than it would otherwise be.) Alternatively, the Fed could do more to increase inflationary expectations which, in turn, would reduce real interest rates, decrease real money demand, and increase velocity. Third, there is no reason yet to pull the plug on the existing expansionary policies. Rather, as Paul Krugman notes (HT Mark Thoma) policymakers need to stay the course until it is clear that the money multiplier and velocity have recovered.

Tuesday, June 9, 2009

Roubini to Green Shoots Crowd: "Get Out Your Weed Eaters!"

Nouriel Roubini tries to sober up all those observers drunken with green shoots tonic:
Those tentative green shoots that we hear so much about these days may well be overrun by yellow weeds even in the medium term, heralding a weak global recovery over the next two years.

First, employment is still falling sharply in the US and other economies...This will be bad news for consumption and the size of bank losses.

Second, this is a crisis of solvency, not just liquidity, but true deleveraging has not really started, because private losses and debts of households, financial institutions, and even corporations are not being reduced, but rather socialized and put on government balance sheets. Lack of deleveraging will limit the ability of banks to lend, households to spend, and firms to invest.

Third, in countries running current-account deficits, consumers need to cut spending and save much more for many years. Shopped out, savings-less, and debt-burdened consumers have been hit by a wealth shock (falling home prices and stock markets), rising debt-service ratios, and falling incomes and employment.

Fourth, the financial system – despite the policy backstop – is severely damaged. Most of the shadow banking system has disappeared, and traditional commercial banks are saddled with trillions of dollars in expected losses on loans and securities while still being seriously undercapitalized. So the credit crunch will not ease quickly.

Fifth, weak profitability, owing to high debts and default risk, low economic – and thus revenue – growth, and persistent deflationary pressure on companies’ margins, will continue to constrain firms’ willingness to produce, hire workers, and invest.

Sixth, rising government debt ratios will eventually lead to increases in real interest rates that may crowd out private spending and even lead to sovereign refinancing risk.

Seventh, monetization of fiscal deficits is not inflationary in the short run, whereas slack product and labor markets imply massive deflationary forces. But if central banks don’t find a clear exit strategy from policies that double or triple the monetary base, eventually either goods-price inflation or another dangerous asset and credit bubble (or both) will ensue...

Eighth, some emerging-market economies with weaker economic fundamentals may not be able to avoid a severe financial crisis, despite massive IMF support.

Finally, the reduction of global imbalances implies that the current-account deficits of profligate economies (the US and other Anglo-Saxon countries) will narrow the current-account surpluses of over-saving countries (China and other emerging markets, Germany, and Japan). But if domestic demand does not grow fast enough in surplus countries, the resulting lack of global demand relative to supply...will lead to a weaker recovery in global growth, with most economies growing far more slowly than their potential.

So, green shoots of stabilization may be replaced by yellow weeds of stagnation if several medium-term factors constrain the global economy’s ability to return to sustained growth...

Monday, June 8, 2009

There is Nothing Mild About Winters and Recessions in Michigan

Winters in Michigan are not for the light of heart. Neither are the recessions. Below is a figure showing the year-on-year % change in the coincident indicator for the United States and Michigan from January 1980 to April 2009. (Click on figure to enlarge.)


If the movement of economic activity in Michigan could be made into a roller coaster it would be one thrilling ride!

Just When You Thought There Were Signs of Recovery...

Jim Hamilton reminds us that a broad look at the data indicates we are far from a robust recovery. Meanwhile, the King Report (via Barry Ritholtz) dashes even the seemingly one sure sign of recovery, the smaller-than-expected decline in NFP employment. It is widely understood that the key to a robust recovery in the U.S. economy is a restoration of household's and bank's balance sheets. How long will that take?

Tuesday, June 2, 2009

Corporate Bond Spreads Update

Here is an update on the BAA corporate bond yield minus AAA corporate bond yield spread. The overall spread is still elevated at 252 basis points in May 2009, but this is down from the December 2008 peak of 338. (Click on figure to enlarge.)