
I have been arguing here for some time that the Great Recession of 2007-2009 was nothing more than a pronounced money demand shock that the Federal Reserve failed to fully offset. As a consequence, nominal spending collapsed and given sticky prices the real economy crashed too. This seems self evident to me and other so called quasi-monetarists (a term coined by Paul Krugman) like Scott Sumner, Bill Woolsey, Nick Rowe, and Josh Hendrickson. Some folks, however, do not buy it. They disagree that the fundamental problem was a money demand shock and by implication they disagree that the Fed could have done anything to offset it. This thinking can be vividly seen in the responses to my National Review article where I make the case for QE2 with a money demand shock story.
A more thoughtful response to my argument comes from Brad DeLong who says rather than a narrow money demand shock being the underlying cause of the Great Recession, it was a broader liquidity demand shock. Thus, the demand for all highly liquid assets increased and derailed nominal spending. Though some of the quasi-monetarists may disagree with him on the details, I think they would agree with DeLong in general and might even call him a closet quasi-monetarist.
So what is the evidence for DeLong's theory of a great liquidity demand shock? I went to the flow of funds data and looked up the share of highly liquid assets as a percent of total assets for the (1) household and nonprofit sector, (2) the nonfarm nonfinancial corporate business sector, and (3) the nonfarm noncorporate business sector. For highly liquid assets I sum up for each sector currency and checkable deposits, time saving deposits, money market funds, and treasury securities. Presumably, the share of highly liquid assets as a percent of all assets for each sector spiked during the crisis if in fact there was a great liquidity demand shock.
Here is the figure for the households and nonprofit sector:

This figure shows that the share of total assets for households and nonprofits allocated to highly liquid assets was declining since the 1980s. This downward trend was dramatically reversed beginning around 2007 and is still elevated.
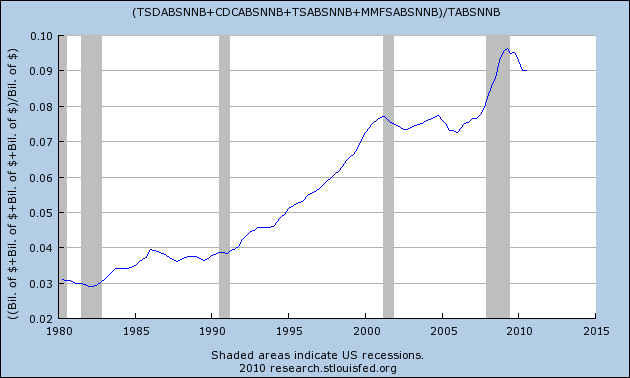
Next is the figure for the nonfarm nonfinancial corporate business sector:

Corporations also saw a spike in their share of highly liquid assets after several decades of very little change. Here too the highly liquid share remains elevated.
Finally, here is the nonfarm noncorporate business sector:
Source
My takeaway from these figures is that (1) there was a great liquidity demand shock and (2) the Fed failed to sufficiently offset it. Presumably, one objective of QE2 is to bring theses shares back into line with pre-crisis values. The figures indicate, though, there is a long way to go before that happens.
Update: If the treasury securities are eliminated from the numerator in the above figures then one gets something that more closely measures the share of assets allocated to traditional money assets. The figures for the three sectors are here, here, and here. These figures are very similar to the ones above. Thus, money demand appears elevated too.
Here too, there is a spike in the share of highly liquid assets. Though the share has gone done slightly, it is still elevated relative to the pre-crisis period.
My takeaway from these figures is that (1) there was a great liquidity demand shock and (2) the Fed failed to sufficiently offset it. Presumably, one objective of QE2 is to bring theses shares back into line with pre-crisis values. The figures indicate, though, there is a long way to go before that happens.
Update: If the treasury securities are eliminated from the numerator in the above figures then one gets something that more closely measures the share of assets allocated to traditional money assets. The figures for the three sectors are here, here, and here. These figures are very similar to the ones above. Thus, money demand appears elevated too.
Very interesting.
ReplyDeleteAny guess as to what caused the shock?
Cheers!
JzB
"My takeaway from these figures is that (1) there was a great liquidity demand shock and (2) the Fed failed to sufficiently offset it."
ReplyDeleteI can see how your figures demonstrate (1).
But how do you get (2) from the figures? ie. use your charts to prove that the increase in demand for liquidity was not satisfied. I think you've taken a leap of chart-logic.
Furthermore, your aggregate is made up of money, demand deposits, savings deposits, and treasuries. You blame the Fed for not meeting the demand for these. But private banks provide the 2nd and 3rd, and the Federal government the fourth. Why single out the Fed?
Lastly, prices for Treasuries are not sticky. An increased demand for the sort of liquidity provided by Treasuries would have been met by a compensating jump in price such that the market cleared. No more excess demand for liquidity.
Did the increase in the household liquidity ratio come mostly from the numerator or denominator? If the latter, what implications does it have for gauging the "liquidity demand shock"?
ReplyDeleteAnother question: what level of the ratio is sufficient to prevent a spike in the ratio during recessions? In other words, if households feel they have sufficient liquidity, they will not feel forced to sell down assets, which in turn would provide support to total asset values. A very low ratio of liquidity in period 1 might lead to a sharp drop in total asset values in period 2. If this is the case, then to what extent should the Fed try to drive the ratio back to its 2005 trough level?
JP Koning:
ReplyDeleteThe fact that the liquidity demand is still elevated tells me the Fed has not done an adequate job. The Fed could have done better on two, related fronts.
First, it should have provided even more monetary base (via purchases of long-term and other assets not typically used in monetary policy) such that housheholds and firms liquidity demand would get satiated and then some. Doing this, though, would change expectations of future economic activity which leads me to my second point.
Second, the Fed should have followed a credible nominal target (i.e. price level or ngdp level target) that would have raised expectations of future nominal spending to offset the collapse in nominal spending from the spike in liquidity demand. Now had nominal spending expectations gone up, so would have real economic expectations and thus so would asset prices. Households and firms would then want to rebalance their portfolio of assets by getting rid of low-yield liquid assets for higher yielding less liquid assets. In the process of getting rid of the money it would eventually get spent fulfilling the very expectation that started the rebalancing in the first place. Also, there would be a wealth effect from rising non-monetary assets that would encourage more nominal spending.
Jazzbumpa: Obviously there was a housing bust and financial crisis one could point to, but a different take is that severity of these shocks would have been far milder had the Fed been more aggressive in addressing the spike in liquidity demand early on.
David Pearson:
ReplyDeleteOn your first question, click on the source links and it will put on the FRED pages where I made the graphs. You can manipulate the figures for yourself, but what I found is that for households it was more the denominator that changed while for the business sectors it was both. With that said, I am not sure that it makes that much difference. For example, if a household's total assets are falling because its real estate and stock assets are losing value and yet it finds a way to maintain its existing money balances despite these developments would indicate liquidity demand is elevated.
I can't answer precisely your second question, but obviously a sudden increase in uncertainty will increase the desired amount of liquidity by households and firms. Thus, there must be some uncertainty shock that causes what would otherwise be a sufficient but low amount of liquidity in period 1 turn into less than sufficient amount in period 2. What the optimal allocation may be is unclear, but it seems hard to believe the existing allocation is it.
Musgrave claims MMT beats QE in a fair fight.
ReplyDeletehttp://ralphanomics.blogspot.com/2011/01/mmt-beats-qe.html
Unless an increase in liquidity demand spills over into an increase in money demand, and the money supply does not increase in proportion to prevent a fall in total spending, an increase in liquidity demand should merely alter the composition of total spending and not its aggregate.
ReplyDeleteThe purchase of financial assets, highly liquid or not, reallocates resources from one use to another. It is only when the intermediation function of banking is frustrated, when an excess money demand emerges, that resources are no longer reallocated from one use to another, but are unallocated -- the price system temporarily becomes blind to their existence.
This talk of liquidity demand misses the point. Excess supplies or demands for liquid assets alters their prices and yields in their respective markets, and so disequilibriums are relatively easy for the price system to resolve. But money has no market of its own, and its "price" cannot change readily except by a general deflation, and that is a process is frustrated because prices are somewhat interdependent.
Since we don't even have agreement 75 years later on what caused the Great Depression, I think we can confidently assert this will run and run. As JK Galbraith said, "Economics is very useful as it provides employment for economists."
ReplyDeleteOne good thing about the last 3 years is that the pretensions of economics as any kind of scientific endeavor have been exploded.
Better by far if we had less econ in grad school and pointed them towards useful subjects such as biological sciences.
Have you estimated the size of QE necessary to get these ratios back to pre-crisis levels? I will be doing this soon just to get an idea of what might happen in the markets.
ReplyDeleteRalph,
I agree, MMT does beat QE. It just will not be implemented anytime soon, so I go with the best we have now, which is guys like DB